As an example, let’s explore a topic close to the hearts of all newlyweds: wedding presents.
The table below shows the responses of 312 newly-wedded couples to the question ‘What wedding presents did you receive?’.
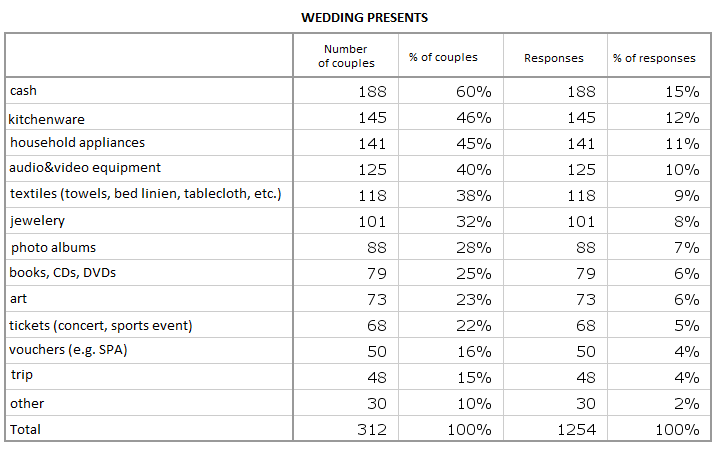
Since couples typically receive multiple presents, to show the percentage distribution we must first determine the percentage base. Typically, the base is the number of respondents (in our case all 312 couples). Alternatively, we may choose the number of all responses as the percentage base (in our case 1254 responses). Depending on the selected statistic the results will vary.
The table shows both methods of percentage calculation. The ‘% of couples’ column tells us that most - 60% - newlyweds received cash, 46% found kitchenware among their gifts, 45% household appliances, etc. If I was planning my wedding today, I would use this type of analysis to predict what gifts I might receive from my guests :)
The other method of presenting results shows percentages based on all responses. If all the couples brought all their presents to one place they would total 1254 as stated in the ‘Total’ cell of the ‘Responses’ column. The last column tells us that among all the presents, 12% would be kitchenware, 9% textiles, and only 4%, vouchers. This type of percentage calculation would be of value to wedding present stores. It may also serve as a guide to my own gift order during the wedding season :)