PS QUAESTIO PRO is a comprehensive solution for data collection and analysis. The program gives the possibility to conduct research using various research techniques, such as CATI, CAWI, PAPI, CAPI or MOBI. The user has the possibility to control the research process, this includes: verifying the correctness of the entered data, managing the sample selection, generating e-mailing campaigns, etc. The collected data can be analyzed using PS IMAGO PRO (the extended version of IBM SPSS Statistics), which provides access to many analytical techniques and data management tools. Based on the collected data, PS QUEASTIO PRO allows the user to quickly prepare attractive reports in the form of dashboards or printed reports.
Benefits
Easy creation of questionnaires
PS QUAESTIO PRO allows the user to efficiently create complex surveys with numerous transition rules, access to multimedia files and data validation. A powerful wizard allows the user to make the surveys attractive graphically.
Efficient use of data
The use of different techniques (CAWI, MOBI, CAPI and CATI) to collect data helps to better match the communication channel to the target group and increase response rates. A wide range of tools allows the user to monitor the research process, take mass actions towards the persons who have not taken part in the survey, and create automatic reports.
Exchange of information with systems
Possibility of conducting the research using data from external systems - e.g. use in real time of information about events determining participation in the study, or the content of the questions asked. Providing full data exchange security.
Raising the response rate
The researchers have a number of tools at their disposal to increase the number of completed questionnaires, including the possibility of customization, sending reminders, changing the survey technique or using information about the moment of abandonment of any previous questionnaires.
Basic and advanced data analysis
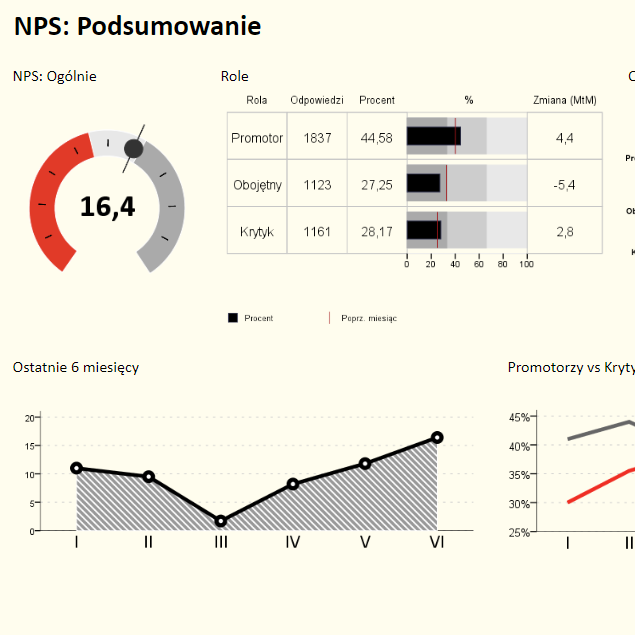
The data collected can be analyzed immediately after the end of the survey. The range of available statistical techniques goes beyond exploratory analysis. It covers a wide range of statistical tests, strengths of measures of association, classification and segmentation techniques as well as prediction. The results can be presented in the form of charts as well as on maps.
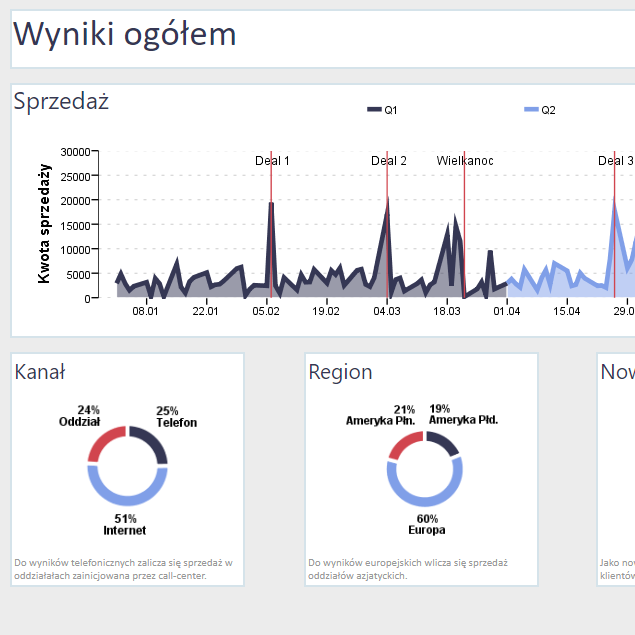
Web and text reports
The results of the survey can be adjusted to the needs of customers. The user can use a web report (.html), which is available to authorized recipients. The objects in the report can be automatically updated. The results may also be presented in a document (.docx .pdf), which, when printed, may be part of the documentation.
Online distribution of reports
A web report is the fastest way to publish results. It is available from the browser level for all authorized recipients. In the case of cyclical reports, they can be executed automatically as part of the process. In this case, after generating a scheduled report, the system can send a notification to selected users.
For whom?

We reach customers all over the world. Only the collection and collation of information gathered in different languages allows me to answer the key questions for the company.
My business is international in nature and all planned global changes must be supported by evidence of their legitimacy. Therefore, it is extremely important for me to be able to obtain information from every corner of the world. The key elements that I pay attention to are the ability to reach a high number of participants in their native language and the ability to easily compare the data collected in this way. It is also important to be able to modify the visual elements.


Automatic and continuous monitoring of data quality, verification of data increments and reporting of results.
When making important decisions, we verify the opinions of citizens and constantly monitor social sentiment. These surveys are expected by decision-makers and provide recommendations.


Reporting requires continuously updated and reliable information. A reporting study gives me an effective tool to obtain such information.
In the case of public administration units, it is important to collect data that are strictly of reporting value. The form of the report must be adjusted to the statutory requirements. A major obstacle is the dispersion and lack of systemic coherence between various territorial units. Effective acquisition of this type of information requires an extensive control functionality, such as cross validations, summaries of given responses, printouts of confirmations etc. the collection of data that are strictly of reporting value. The form of the report must be adapted to the statutory requirements. A huge obstacle here is the dispersion and lack of systemic cohesion between various territorial units. Effective acquisition of this type of information requires a very complex control functionality such as: cross validations, summaries of granted responses, printouts of confirmations, etc.


The management appreciate information about cooperation between the departments. We are able to continuously improve weak elements of the communication process.
Periodic analysis of the quality of cooperation between different departments is one of the most effective ways to control this area of business activity. Using the knowledge provided through PS QUAESTIO PRO, I can quickly respond to disturbing symptoms by e.g. putting adequate corrective procedures in place. Initially, the project was a pilot one. Currently, almost all management staff at the various levels of responsibility use the results obtained.

Offered functions
New in version 9.0
We strive to improve our products,
so that your data will work better for you.
PS QUAESTIO PRO 9.0 – the integrated questionnaire survey environment is available now! Among the new features worth mentioning are:
- A NEW MOBILE TEMPLATE VERSION
- ENCRYPTION OF PERSONAL OR SENSITIVE DATA
- NEW IBM SPSS STATISTICS 31 ANALYTICAL ENGINE
- NEW PROCEDURES FOR DATA MANAGEMENT


